Chart support
A ‘Chart window’ was just introduced in Mapton, the intended use is to display charts when clicking on a map object or similar. The chart can easily be fed with data or to be replaced with a very customized chart object.
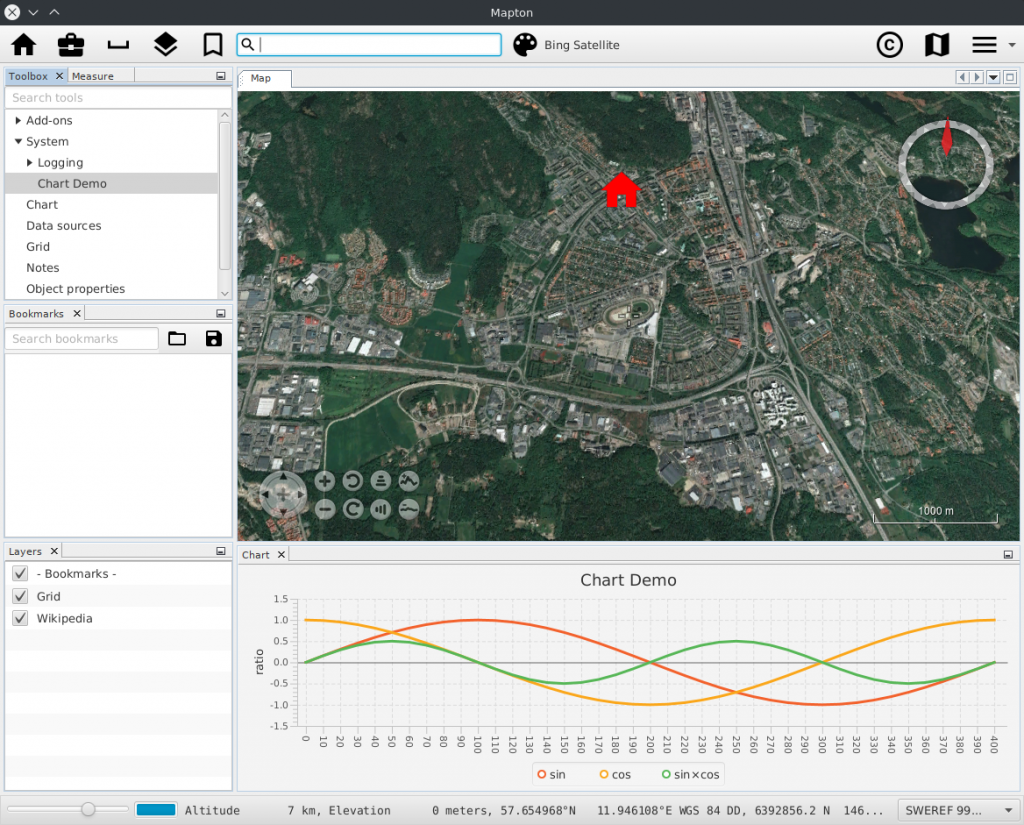
A ‘Chart window’ was just introduced in Mapton, the intended use is to display charts when clicking on a map object or similar. The chart can easily be fed with data or to be replaced with a very customized chart object.
After more than a year of development it’s time to release the first version of Mapton.
Some of the changes since the March snapshot are:
…and the usual fixes and tweaks